



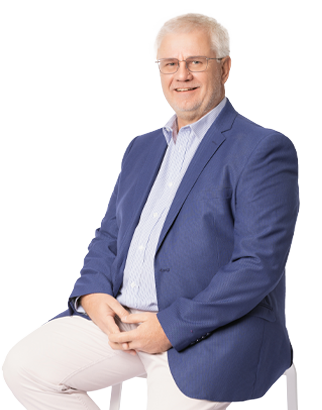
Dirk Reyneke
Group Chief Financial Officer
| Group operating revenue decreased 1.1 % to R42.8 billion |  |
| EBITDA decreased 0.5%1 to R11.9 billion |  |
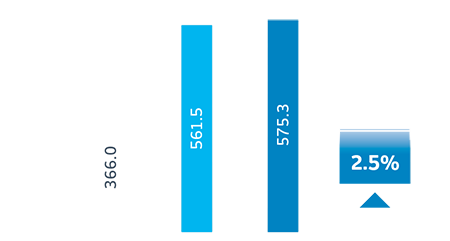
| Headline earnings per share (HEPS) increased 2.5%1 to 575.3 cps |  |
| Basic earnings per share (BEPS) increased 1.4%1 to 536.6 cps | |
| Free cash flow decreased 200.8% to a negative R2.1 billion2 |  |
| Net debt to EBITDA decreased 0.3 times to 1.2 times2 |  |
| 1 | Excludes the impact of VSP, VERP and S189 costs of R270 million and the related tax impact of R76 million in the comparative year. |
| 2 | Includes spectrum funding of R1.1 billion. |
Group performance remained under pressure in FY2022, primarily due to the lingering impact of the COVID-19 lockdown, global supply chain constraints and shortages of semiconductor chips. This was exacerbated by an intensely competitive trading environment.
Despite the revenue headwinds, our profitability and earnings remained stable, underpinned by our sustainable cost management. We are pleased that our balance sheet remains stable.
A solid financial framework is imperative going forward to support the Group Strategy and deliver sustainable returns for shareholders.
| VSP, VERP and S189 |
No further restructuring costs were recorded in FY2022. An expense of R270 million was recognised in FY2021, with a related tax impact of R76 million. |


Revenue headwinds |
|
Group revenue declined marginally by 1.1% to R42 756 million, supported by the Mobile business. Despite the intense competition and challenging economic environment, Mobile’s service revenue increased by 3.3% to R17 505 million, underpinned by strong customer growth and stable post-paid ARPU. The customer base grew by 10.5% to 16.9 million at a blended ARPU of R90, with a post-paid ARPU holding firmly at R212.
This performance was offset by a decline in the fixed and IT businesses, which remain under pressure due to the challenging operating environment and a decline in the fixed business as customers continue to migrate to modern technologies such as fibre and LTE. Although these businesses’ top lines declined compared to FY2021, the rate of decline improved compared to the first half of the year.
The stability in the fixed business is attributable to a decline in fixed voice churn and an increase in usage, as there was improved economic activity in FY2022 compared to FY2021.
Masts and towers revenue increased by 4.4% to R1 292 million. The growth in revenue was driven by commercialising the existing portfolio, new tower builds, and the rollout of IBS. Commercially non-productive towers were decommissioned as we continued to optimise the operational efficiency of the portfolio.
The impact of the post-pandemic recovery is still evident in small and medium businesses. We remain encouraged by the growth in our non-connectivity/application services with a 13% growth to R827 million in our mobile financial service and micro-content services.
As a result of our deliberate strategy of investing in new revenue streams, we evolved our business from a legacy to a next-generation business. The next-generation revenue streams now contribute more than 70% to Group revenue.
Stable profitability |
|
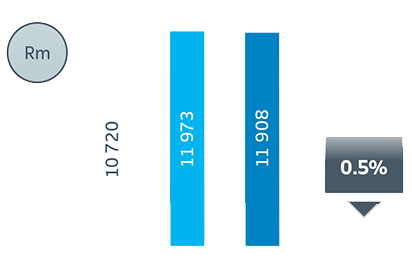
Underlying Group EBITDA is stable at R11 908 million and the EBITDA margin expanded by 0.2 ppts to 27.9%. This was underpinned by our sustainable Cost Management Programme, which aims to contain opex growth below inflation and optimise cost to serve. Opex declined by 4% year on year despite an average Group-wide salary increase of 6%, which was effective from 1 April 2021.
Mobile’s cost to serve was optimised despite the increase in costs associated with the post-paid market such as distribution channel costs. The improvement in cost to serve was enabled by optimised roaming costs as we maintain stringent roaming traffic thresholds and migrate traffic to our network, supported by the ongoing network investment.
The reduction in opex and optimisation of our cost to serve resulted in a reduction in our total cost to revenue ratio, which reduced by 0.1 ppts to 73.7% as shown below.
EBITDA

EBITDA margin

Total cost to revenue ratio*
| * | Total cost includes direct and operating expenses. |
Stable earnings growth |
|
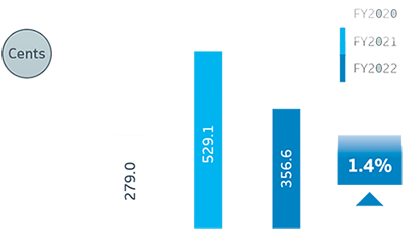
Reported HEPS increased by 10.2% to 575.3 cents while reported BEPS increased by 9.5% to 536.6 cents compared to FY2021. Excluding the VSP, VERP and S189 costs in FY2021, underlying HEPS increased by 2.5%1 and BEPS by 1.4%1 year on year. This was due to a significant decline in finance charges and fair value movements compared to the prior year.
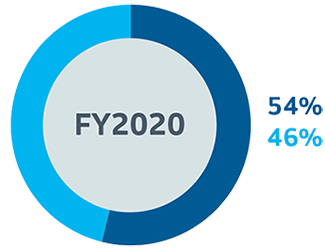
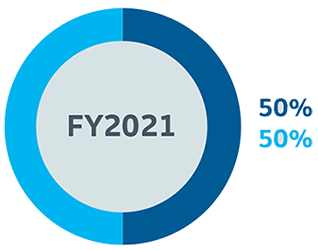
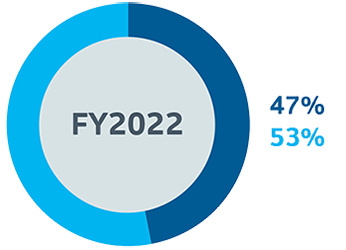
Finance charges and fair value movements declined by 16.2% to R1 279 million, largely as a result of lower finance charges. Lower interest rates as well as the settlement of the SARS liability in the prior year resulted in finance charges reducing by 17.7% to R662 million. Our funding strategy allowed us to balance our cost of debt ratio to 53:47 floating to fixed. This ensures that the risk of changes in interest rates remains balanced.
| 1 | Excludes the impact of VSP, VERP and S189 costs of R270 million and the related tax impact of R76 million in the comparative year. |
Fixed to floating debt ratio
BEPS
HEPS
Free cash flow under pressure |
 |
Cash preservation remains key in the current volatile economic environment. We generated negative FCF of R2 080 million largely due to R1 142 million invested in spectrum. Excluding the impact of spectrum acquisition, we generated an underlying negative FCF of R938 million. The decline in underlying FCF is largely due to the capex overhang of R1 070 million relating to prior year capex that was settled in the current year, revenue decline and working capital movements. Working capital deteriorated in the current year, despite R1 009 million of handset financing. The deterioration in working capital is largely due to timing of cash flows, as a result of an increase in post-paid mobile handset sales and purchases following the gradual reopening of the economy post the COVID-19 lockdown.
| FCF movement | FY2022 Rm |
Restated FY2021 Rm |
Change % |
|||
| Cash generated from operations spectrum costs paid | 9 886 | 14 383 | (31.3) | |||
|---|---|---|---|---|---|---|
| Repayment of lease liability | (1 076) | (856) | (25.7) | |||
| Interest received | 235 | 332 | (29.2) | |||
| Finance charges paid | (1 188) | (1 291) | 8.0 | |||
| Taxation paid | (764) | (2 194) | 65.2 | |||
| Operating free cash flow before capital expenditure | 7 093 | 10 374 | (31.6) | |||
| Spectrum acquisition | (1 142) | – | (100.0) | |||
| Cash paid for capital expenditure | (8 031) | (8 311) | 3.4 | |||
| Free cash flow | (2 080) | 2 063 | (200.8) | |||
| Free cash flow excluding spectrum | (938) | 2 063 | (145.5) |
Stable balance sheet |
|
In FY2022, we settled a R193 million debt in line with our debt maturity profile. This is over and above the R1 400 million matured debt repaid in the prior year. We have adequate balance sheet capacity to fund our strategy despite the acquisition of spectrum of R1 142 million in the current year, which resulted in net debt to EBITDA increasing to 1.2x. Excluding spectrum, net debt to EBITDA is 1.1x driven by a 35.2% decrease in the cash balances at the end of the year and additional leases to support Mobile, thus increasing IFRS 16 lease liabilities.
| FY2022 Rm |
FY2021 Rm |
Change % |
|||||
| Cash balances | 3 239 | 5 002 | (35.2) | ||||
|---|---|---|---|---|---|---|---|
| Interest-bearing debt | 11 932 | 10 866 | (9.8) | ||||
| Operating balance | 10 866 | 12 005 | 9.5 | ||||
| Net funding repaid | (193) | (1 132) | (83.0) | ||||
| Spectrum funding | 1 150 | – | (100.0) | ||||
| Other | 109 | 7 | (1 457.1) | ||||
| Lease liabilities | 5 374 | 4 972 | (8.0) | ||||
| Opening balance | 4 972 | 4 775 | (4.1) | ||||
| IFRS 16 lease liability raised | 402 | 197 | (104.1) | ||||
| Net debt | 14 067 | 10 836 | (29.8) | ||||
| Net debt/EBITDA times | 1.2 | 0.9 | (0.3) | ||||
| Net debt/EBITDA times excluding spectrum funding | 1.1 | 0.9 | (0.2) | ||||
| Average cost of debt (%) | 6.5 | 6.2 | (0.3) | ||||
Fixed to floating debt ratio
FY2022 has been a reset year following changes in the global market, regulatory environment, intense competitive landscape, and weak macro-environment. A stable financial framework to support the Group strategy and deliver sustainable returns for shareholders is key going forward. We will focus on enhancing our financial framework where the Group is expected to return to growth from FY2023.
Our Mobile business has grown ahead of the market and secured a third-market position. Going forward, we expect Telkom Mobile to grow in line with its industry peers while we expect overall fixed data revenues to start growing from FY2023.
We will continue to focus on the following to maintain a stable financial framework:
Growth in Mobile, fibre and the masts and towers business enables us to grow and defend our revenues.
Tight control on cost escalation through our sustainable Cost Management programme, with a focus on legacy and roaming costs allows us to contain opex below inflation and optimise our direct costs.
We will continue to maintain a disciplined capital allocation framework, thus growing shareholder value over the long term. In allocating capex, we will prioritise capex investments that give us a reasonable return, i.e. WACC + 2% – 3%.
Protecting our balance sheet remains a key focus area to fund growth and withstand the volatile trading environment.
Given the slowdown in growth in the Mobile business and continuous decline in the legacy business, Group revenue will grow at mid-single digits over the medium term to FY2025. Underpinned by our ongoing sustainable cost management, we aim to grow Group EBITDA at mid-single digits over the medium term to FY2025. We expect to continue to invest in the business with a capex to revenue ratio of between 16% and 18% per annum and to maintain a healthy balance sheet with net debt to EBITDA of 1.2x (including the acquisition of spectrum).
| FY2023 – FY2025 Guidance* |
|
| Revenue (CAGR) | Mid-single digits |
|---|---|
| EBITDA (CAGR) | Mid-single digits |
| Capex to revenue ratio per annum* | 16% – 18% |
| Net debt to EBITDA (times) | Less or equal to 1.2x |
| * | Excluding spectrum acquisition |
Returning cash to shareholders remains a key element of our capital allocation framework. Telkom is in year two of the three year dividend suspension period. The Board remains committed to reinstate the dividend policy at the end of FY2023 in line with the Board commitment on suspension of the dividend policy in FY2020. The Board is reviewing the dividend policy. It is imperative for Telkom to generate sustainable positive FCF to reward shareholders. In the current year, acquisition of spectrum took priority in line with the capital allocation framework principles of prioritising growth.
Dirk Reyneke
Group Chief Financial Officer (GCFO)